Blog
Top 5 ways your home care organization can leverage data exploration now

We’ve written extensively on the importance of data when it comes to providing your agency with meaningful, quantitative insights and decision-making support. We’ve also invested heavily in our own software to offer the most intuitive, accurate reporting capabilities – so it’s as easy as possible to pull the information you need.
Data is no longer the domain of tech-minded companies; it is omnipresent, easier to use than ever before, and omni-useful. The ability to capture and use data is integral to any successful home care agency.
“AlayaCare has enabled Acclaim Health to truly become a data-driven decision making organization. We’ve realized new efficiencies that have helped our staff work remotely, improve our communications, and bolster our client experience”
Kelly McWilliams, Senior Director of Health Services at Acclaim Health
AlayaCare’s data exploration tool
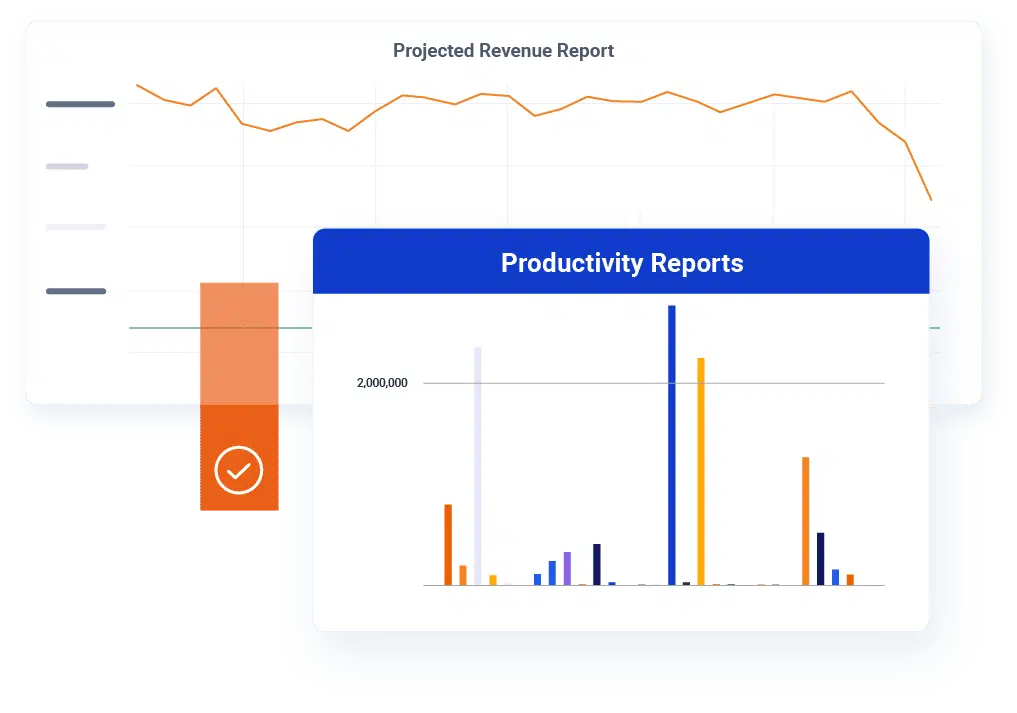
Our data exploration tool can empower your agency to report on nearly any data stored within the platform – and adjust operations based on what the numbers are saying.
With this tool, you can easily report on data, create dashboards and calculations, and manipulate the information within the software with the new feature. The data can be exported and displayed in various visual formats for accessible, at-a-glance insights.

5 key areas driven by home care data
Although there are plenty of use cases for data exploration in home-based care, we compiled a list of the top five areas your organization should focus on if you want to take data exploration to the next level.
1. Delivering care to clients
Underpin your mission with data-rich reports that ensure each client receives the care they expect when they expect it. The essence of providing home care requires care continuity, proper scheduling, and skilled caregivers themselves, but there is intel available that can inform you if care is up to the level upon which your agency’s reputation is built.
Example reports include:
- Clock-in/out accuracy: Understand how accurately your caregivers document their start and end times for each shift and each client visit.
- ADL percentage completion: Activities of daily living are a vital tool for understanding each client’s care needs. This metric ensures caregivers consistently follow visit requirements and perform necessary ADLs.
2. Business operations
Gaining insights into how your business compares against other offices, the industry average, and more across key benchmarks can help visualize where efficiencies can be gained and improvements made. In short, you’ll see what is working well. Visualizing key metrics makes it easy to ensure you’re increasing your revenue, maximizing resources, and streamlining operations.
Example Reports include:
- Client lifecycle: Gain a holistic view of your client’s life cycle with your agency.
- Weekly/monthly scheduled or projected hours: Are your caregivers receiving equal and/or preferred shifts? Quickly see projected hours and understand capacity.
- Scheduler utilization: Identify how many hours and visits your schedulers are creating and ensure that the quality of those schedules is high for your care staff and client outcomes.
- Client census/employee census: Increasing the census and your circle of referral partners is imperative for growth. Determine where there are gaps efficiently and effectively.
- Under/over utilization of authorizations: Quickly identify clients who are not receiving their authorized hours and proactively fix schedules of clients who may have exceeded authorized hours that will not be reimbursed.
3. Population health
Population data is an essential component of health care research but it is also integral to your agency. Knowing the broad trends among your client roster or groups of clients helps you serve them better, helps them achieve greater wellness, and promotes a more equitable health care system. Understanding your client population allows you to consider better their social determinants of health, the non-medical elements contributing to someone’s health and wellness. Using data in this area helps you go above and beyond to reduce stress among clients, improve their mental health, reduce ER visits, and boost wellness and disease prevention.
Example reports include:
- Diagnosis by age range, gender, and geographic area: To better serve your client population, increase your understanding of their basic demographics and care needs. Are you seeing a spike in clients with dementia, an increase in falls, or UTIs? Use these reports to take proactive approaches to reduce re-hospitalization risk, run specific training for your staff, and adjust care plan templates.
- Care plan completion by diagnosis: Track how well weekly or monthly care plan goals are being met – and break it down further by health condition category to identify where greater client support is needed.
- COVID risk scores: Gauge your client population’s risk levels for COVID-19 – and any infectious disease that is either a consistent threat or spikes at certain times of the year, such as the flu.
4. Employee retention
With a 64% industry turnover in the U.S. alone and the average annual cost of churn at $4,500, keeping your employees happy is extremely important in an industry where competition to find and retain top talent is fierce. Our Recruitment and Retention Survey revealed that a lack of hours was one of the top reasons for churn – and that, along with several other key insights, can be easily monitored via our data exploration tool.
Example reports include:
- Employee onboarding lifecycle: How long has it been since you hired an employee vs. when they received their first shift? Leaving someone idle for too long is a recipe for churn.
- Employee cancellations/missed visits: While this is important to know from a client care standpoint, such a report also gives insight into how engaged a caregiver is with your agency.
- Employee expiring skills/qualifications: It’s key to stay current on certifications for specialty care needs, such as dementia care, CPR, and more.
- Employee satisfaction levels: Our retention dashboard gives you an important look at how your staff is faring, spotting changing trends, and preventing possible churn.
- Capacity planning reports: How many caregivers do you have on staff, and how many will you need in six months or one year? This report can offer insights into your capacity and hiring needs.
5. Billing reports
The wide variety of billing reports available with our data exploration tool can uncover actionable insights into your financial operations, which can, in turn, improve business processes, help you make informed decisions, and provide more personalized customer experiences. In fact, companies using analytics are five times more likely to make faster decisions.
Example reports include:
- AR reports: To monitor missing payments, you can easily view unpaid invoice balances and the duration for which they’ve been outstanding.
- Monthly/annual target billable hours: Are you meeting your targets each month? Catch potential issues before they become problems.
- Projected revenue: Understand where your revenue sources are coming from and forecast growth at a glance.
- Client/department profitability: How profitable are your various departments or locations? Gain an understanding of where inefficiencies may be.
- Margins Reports: Get creative with gross margin reports (complete with caregiver mileage and OT hours baked in) or a margin report for every visit on a particular day or month. Monitor the details impacting the bottom line.
- Gross profit reports: Focus on exactly how your agency is performing financially, minus all costs, in any time period you choose. Then, compare periods to assess growth.
- Banked units: Do your regulators permit unit “banking” so half or quarter units aren’t lost? Our e-billing module can assemble fractional hours into whole ones. You can run a report to see how much your agency is gaining through this specific element.
Top 10 key reports for agency owners
Download this checklist to learn what key analytics reports your agency should monitor and analyze to improve operational efficiencies.
Top 10 key metrics for administrators
Download this checklist to learn key metrics administrators should monitor and analyze to improve administrative efficiencies.
Data is truly the foundation of an agency – a critical component that enables you to make smart, efficient decisions about your business. With a powerful tool like AlayaCare’s Data Exploration, you can unlock the limitless potential that can fuel the knowledge and insight necessary for growth and profitability.
Speak to an expert today and start leveraging the power of data exploration.